-
Overview module
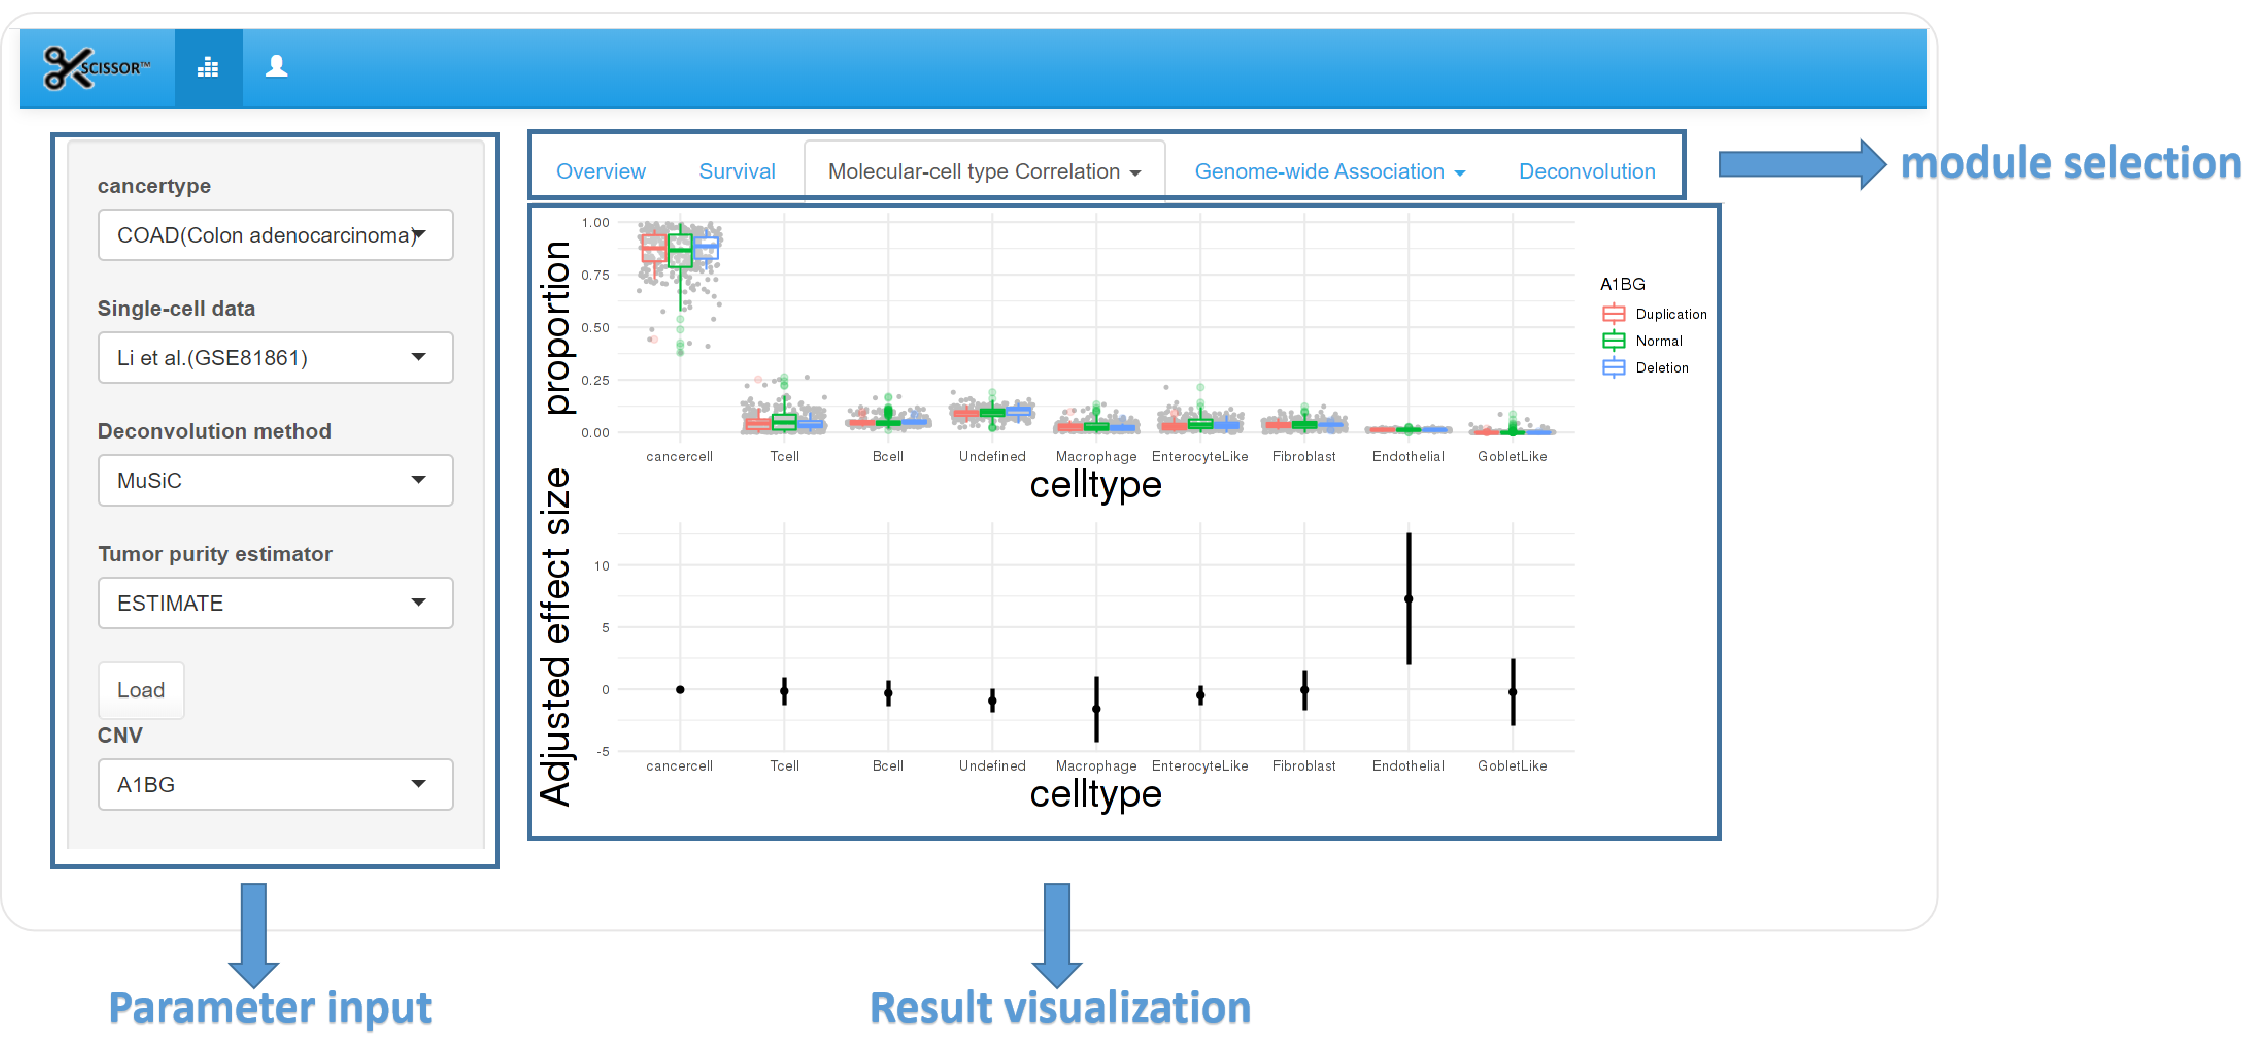
1) Parameter input
Cancertype: Select a cancer type of interest, abbreviation is from TCGA database.
Single-cell data: Select the single-cell data which will be applied to deconvolution.
Deconvolution methods: Select the deconvolution method to estimate cell type proportion.
Tumor purity estimator: Select the way to estimate tumor purity. Which will be used to adjust tumor purity in next modules. SingleCell_Estimation is estimated by single-cell data if cancer cell is available in it.
Once set, users should press Load button. If any change should be made, please
re-input
again and
re-press
the Load button.
2) Result visualization
Heatmap is applied to show the distribution of deconvolution result of each sample in TCGA database.
Boxplot is used to demonstrate the proportion of each cell type.
-
Survival module
1) Parameter input
Gene: optional in this module
Mapped miRNA/mapped protein: if gene is selected, mapped miRNA and mapped protein will be available to be put into model as quantitative variable.
Mapped mutation/mapped cnv: if gene is selected, mutation and copy number variation of the gene will be available to be put into the model.
Cell type: the deconvolution result, users can choose certain cell types to adjust in model, and the kaplan-meier curves will be drawn.
Covariance: covariances including gender, age, race and so on available in TCGA database. Tumor purity is estimated as selected before.
Percentage of patients: A slider bar between 0 to 50%, it defines the division of patient in quantitative variables. The default number is 50%, which means patients will be divided by median. The smaller the percentage, the bigger difference there may be in the variant.
After all variables are set, press Survival Plot to update the result.
2) Result visualization
The result of multivariate cox model is shown, adjusted by the covariant chosen.
Kaplan-meier plots are drawn to show the difference in groups by variables. Quantitative data is divided by median or quartile set before. P-value of log-rank test is shown as well.
-
3.Molecular-cell type module
1) Parameter input
Gene and cell types are required in this module.
2) Result visualization
Scatterplot is used to show the correlation between cell types and quantitative omic data including miRNA, gene expression and protein before and after adjustment for tumor purity. Correlation is calculated and p-value is shown on the plot.
Boxplot is applied to show the distribution of qualitative omic data including mutation and copy number variation in different cell types. Adjusted effect size of different cell types is calculated and shown in scatterplot.
-
4.Genome-wide association module
1) Parameter input
In cell type tab, if users input All as default, a heat map will come out in which the x-axis is cell type while y-axis is top 200 most correlated genes in database (top 100 most positively correlated genes + top 100 most negatively correlated genes). The value is the correlation.
2) Result visualization
Once a certain cell type is decided, a density plot will be demonstrated to show the distribution of correlation value with every genes, and the mean correlation value.
Top 200 correlated genes are shown below and can be downloaded as well.
-
5.Deconvolution module
Parameter input
Users can upload their own data in the form of the example data. And choose the deconvolution reference cancer type, single-cell data and deconvolution method, they can provide their email and the result will be sent to the address once the background calculation completed. If something wrong happen to the upload data, the warning will also be sent, you can contact us to find possible solution to it.
We can also perform deconvolution for users. Users can upload their own bulk data to our website in the form of txt. The data format should be in line with the example data.